How to Create Diagrams for SIWES and Final Year Projects (Step by Step Guide)
Learn how to create professional diagrams for SIWES and final year projects in Nigeria. Step by step guide with examples of flowcharts, ER diagrams, and system design. No design skills needed.

If you are writing a SIWES report or final year project in Nigeria, one thing can instantly improve your work and impress your supervisor:
Clear, well structured diagrams.
But here is the problem.
Most students:
- Struggle with drawing diagrams in Word
- Waste hours dragging shapes around
- Or skip diagrams completely
This guide will show you how to create clean, professional diagrams easily, even if you have never done it before.
Why Diagrams Matter in SIWES and Final Year Projects
Lecturers do not just want text. They want visual explanations.
Diagrams help you:
- Explain processes clearly
- Show system structure at a glance
- Make your report look professional
- Score higher in presentations and defense
Where Diagrams Go in Your Report
For SIWES:
Diagrams are commonly used in these sections:
- Chapter 2 Organizational Structure
Organogram showing company hierarchy - Chapter 3 Training Activities and Practical Experience
Flowcharts showing:- Work processes
- Step by step procedures
- Task execution
- Optional:
- Simple charts such as pie charts to show task distribution or time spent
For Final Year Projects:
- Chapter 3 System design
- Chapter 4 Implementation
Types of Diagrams You Should Know
Here are the most relevant diagrams for SIWES and final year projects:
1. Flowcharts (Most Important for SIWES)
Used to show step by step processes
Examples:
- Daily work activities
- Task execution process
- Technical procedures
2. Organogram (For SIWES Chapter 2)
Shows:
- Company structure
- Departments
- Reporting hierarchy
This is required in almost every SIWES report.
3. System Design Diagrams (For Final Year Projects)
Used to show:
- Frontend to backend to database
- System architecture
4. ER Diagrams (Database Design)
Shows:
- Tables
- Relationships
- Fields
5. Sequence Diagrams
Shows how systems interact over time
6. Charts (Optional for SIWES)
Used to visualize:
- Task distribution
- Time allocation
- Work frequency
Examples:
- Pie charts
- Simple bar charts
The Old Way vs The Smart Way
Old Way (What most students do)
- Open Word
- Insert shapes
- Connect arrows manually
- Spend hours adjusting
Result: messy diagrams
Smart Way (Recommended)
Use an AI diagram tool like Diagflow by MonoEd.
You simply:
- Describe your process in plain English
- Generate the diagram instantly
- Export as PNG or SVG
- Paste into Word or Google Docs
No design skills needed.
Step by Step: How to Create a Diagram (Fast Method)
Step 1: Write Your Process in Plain English
Example:
A student logs into the portal
The system validates credentials
If correct, dashboard opens
If wrong, error message is shown
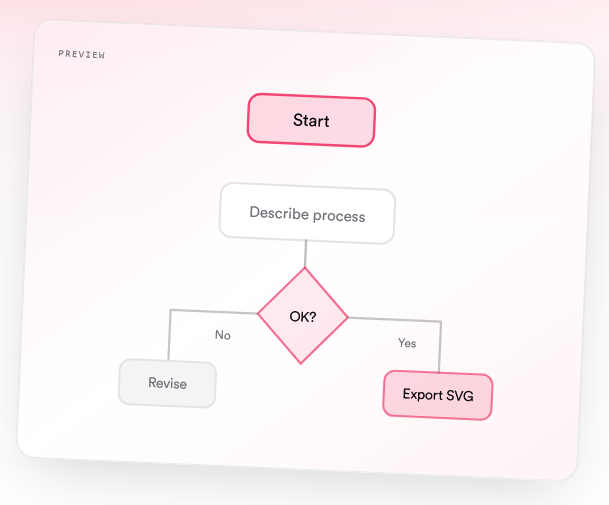
Step 2: Generate the Diagram
Paste the text into Diagflow and generate your diagram.
Step 3: Choose Diagram Type (Optional)
You can select:
- Flowchart
- ER diagram
- Sequence diagram
- Class diagram
Or leave it on auto.
Step 4: Export Your Diagram
- PNG (2x) is best for Word and slides
- SVG is best for high quality and editing
Step 5: Insert Into Your Report
- Open Word or Google Docs
- Insert image
- Add caption
Example:
Figure 3.1: System Login Flowchart
Example: SIWES Methodology Flowchart
Let us say you worked in an office.
Process:
- Receive task
- Analyze requirements
- Execute task
- Submit result
- Supervisor reviews
This becomes a clean flowchart in seconds using Diagflow.
Example: Final Year Project Diagram
Student Result Management System:
- Student logs in
- Requests result
- System queries database
- Result displayed
This is perfect for:
- Chapter 3
- Project defense slides
Tips to Make Your Diagrams Look Professional
- Keep text short and clear
- Use consistent flow from top to bottom
- Do not overcrowd diagrams
- Label everything properly
- Always add figure captions
Common Mistakes Students Make
Avoid these:
- Drawing diagrams manually in Word
- Using blurry screenshots
- Copying diagrams from Google which can lead to plagiarism
- Adding too much text inside diagrams
Why Use Diagflow Instead of Word or SmartArt?
- Faster
- Cleaner layouts
- No alignment issues
- Export ready for reports
- Works with Word, Google Docs, Notion, and Slides
Conclusion
Creating diagrams for SIWES and final year projects does not have to be stressful.
Instead of struggling with shapes and formatting, you can:
- Describe your idea
- Generate a clean diagram
- Focus on your actual report
If you want faster and cleaner diagrams, try Diagflow and see the difference.
FAQs
1. Are diagrams compulsory in SIWES reports?
In many Nigerian institutions, yes. The most common ones are:
- Organogram in Chapter 2
- Flowcharts in Chapter 3
Even when not mandatory, they improve clarity and grading.
2. Which diagram is best for SIWES?
Flowcharts are the most commonly used because they clearly explain processes.
3. What diagrams are needed for final year projects?
Common ones include:
- System design diagrams
- ER diagrams
- Flowcharts
- Data flow diagrams
4. Can I create diagrams without software like Visio?
Yes. Tools like Diagflow allow you to generate diagrams from plain English without design skills.
5. Should I use PNG or SVG in my project?
- PNG is best for Word and presentations
- SVG is best for high quality scaling and editing
6. Can I copy diagrams from the internet?
Not recommended. It can lead to plagiarism issues. It is better to generate your own diagrams.
About the Author
Mohammad-Jamiu B. Balogun, GMNSE
Founder of MonoEd
First-Class Telecommunications Engineer (BUK) | Full Stack & AI Developer
Mohammad-Jamiu graduated with First-Class honors from Bayero University, Kano. He built MonoEd to make school life easier for students from SIWES logbooks and reports to final year projects and professional CVs — all in one platform built for students. His tools have helped over 10,000 students across Nigeria save time and reduce stress.