ER Diagram for Final Year Projects (With Examples and Step by Step Guide for Students)
Learn how to create an ER diagram for your final year project. Step by step guide with clear examples for Nigerian students working on database systems.

If you are working on a final year project, especially in Computer Science, IT, or related fields, one diagram you cannot avoid is:
The ER diagram.
Many students struggle with this part because:
- They do not understand what to include
- They are confused about relationships
- They try to draw it manually and get stuck
This guide will show you how to create a clean and correct ER diagram step by step using simple examples.
Quick Summary
- ER diagrams show how your database is structured using entities, attributes, and relationships
- They are usually included in Chapter 3 or Chapter 4 of final year projects
- Common examples include student registration and e-learning systems
- To create one, identify entities, add attributes, and define relationships
- Keep your diagram simple, clear, and well organized
- Use a tool like Diagflow to generate your ER diagram quickly instead of drawing manually
Want to create your diagram instantly? Try Diagflow here.
What Is an ER Diagram?
An ER diagram, also known as an Entity Relationship diagram, is used to design and represent a database structure.
It shows:
- Entities which are tables
- Attributes which are fields
- Relationships between entities
In simple terms, it is a visual map of how your database is organized.
Where the ER Diagram Goes in Your Project
In most Nigerian universities and polytechnics, the ER diagram is included in:
- Chapter 3 System Design
or - Chapter 4 System Implementation
It is often placed under database design or system architecture sections.
Example caption:
Figure 3.2: Entity Relationship Diagram of the Proposed System
Why ER Diagrams Are Important
An ER diagram helps you:
- Clearly show your database structure
- Explain relationships between tables
- Improve your project documentation
- Make your work easier to understand
Supervisors expect to see this in database related projects.
Key Components of an ER Diagram
1. Entities
These represent tables.
Examples:
- Student
- Course
- Lecturer
2. Attributes
These are fields inside each entity.
Example for Student:
- Student_ID
- Name
3. Relationships
These show how entities are connected.
Example:
- A student registers for a course
4. Primary Keys
Unique identifiers for each entity.
Example:
- Student_ID
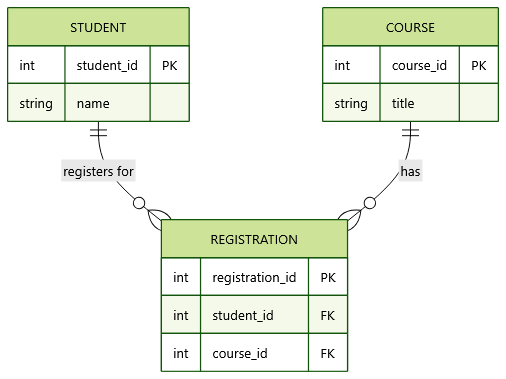
Example 1: Student Registration System
Let us consider a simple project.
Entities:
- Student
- Course
- Registration
Relationships:
- A student can register for many courses
- A course can have many students
Attributes:
Student:
- ID
- Name
Course:
- Course_ID
- Course_Name
Registration:
- Registration_ID
- Student_ID
- Course_ID
Example 2: E Learning Platform
Entities:
- User
- Course
- Instructor
Relationships:
- Users enroll in courses
- Instructors manage courses
Step by Step: How to Create an ER Diagram
Step 1: Identify Your Entities
Think about the main objects in your system.
Examples:
- Users
- Products
- Orders
Step 2: Add Attributes
List the details each entity will store.
Example:
User:
- ID
- Name
Step 3: Define Relationships
Determine how entities are connected.
Ask:
- Can one entity relate to many others
- Is it one to one or one to many
Step 4: Organize the Structure
Arrange entities clearly and connect them with relationships.
Keep it simple and readable.
Step 5: Generate the Diagram
Instead of drawing manually, use a tool like Diagflow by MonoEd.
You simply:
- Describe your database structure
- Generate the ER diagram
- Export it as PNG or SVG
Step 6: Insert Into Your Project
- Place it in Chapter 3 or 4
- Add a proper caption
Example:
Figure 3.3: ER Diagram of Student Management System
Sample Prompt You Can Copy
You can use this:
A system has students, courses, and registrations. A student can register for many courses. Each course can have many students. The registration table connects students and courses and includes registration ID.
Common Mistakes to Avoid
- Adding too many unnecessary entities
- Using unclear relationships
- Forgetting primary keys
- Making the diagram too complex
- Copying diagrams from the internet
Tips for a Clean ER Diagram
- Use clear and meaningful names
- Keep the design simple
- Show relationships clearly
- Include primary keys
- Avoid overcrowding
Manual vs Smart Method
Manual Method
- Time consuming
- Hard to edit
- Easy to make mistakes
Smart Method
- Faster
- Cleaner structure
- Easy to update
- Export ready
Using a tool like Diagflow helps you generate accurate diagrams quickly.
Conclusion
The ER diagram is one of the most important parts of your final year project if your system involves a database.
Instead of struggling with manual drawing, focus on:
- Understanding your system
- Defining entities and relationships
- Presenting it clearly
A clean ER diagram makes your project easier to understand and improves your overall presentation.
FAQs
1. Is an ER diagram compulsory in final year projects?
Yes, for most system based or database projects.
2. Can I create an ER diagram without software?
Yes, but it is not recommended. Using a diagram tool is faster and more accurate.
3. What is the difference between ER diagram and database schema?
An ER diagram shows relationships visually, while a schema defines the actual database structure.
4. How many entities should my ER diagram have?
It depends on your project, but most student projects have between 3 and 10 entities.
5. Should I include attributes in my ER diagram?
Yes, attributes are important to show what each entity contains.
6. Can I use the ER diagram in my defense presentation?
Yes. It is often used to explain your system design.
About the Author
Mohammad-Jamiu B. Balogun, GMNSE
Founder of MonoEd
First-Class Telecommunications Engineer (BUK) | Full Stack & AI Developer
Mohammad-Jamiu graduated with First-Class honors from Bayero University, Kano. He built MonoEd to make school life easier for students from SIWES logbooks and reports to final year projects and professional CVs — all in one platform built for students. His tools have helped over 10,000 students across Nigeria save time and reduce stress.